Adding tracers to a flow simulation
Immiscible Tracers Introduction WellsJutulDarcy supports tracers, which are concentrations that flow in one or more phases. These tracers can be passive, or they can be active and change the properties.
This example demonstrates passive tracers for a simple model with two injectors. We will add a different type of tracer to each injector so that we can show what region of the reservoir is being flooded by each injector.
Set up mesh and identify the well cells
using Jutul, JutulDarcy, GLMakie
Darcy, kg, meter, day, bar = si_units(:darcy, :kg, :meter, :day, :bar)
ny = 20
nx = 2*ny + 1
nz = 1

g = reservoir_mesh((nx, ny, nz), (2000.0, 1000.0, 100.0))

c_i = cell_index(g, (nx÷2+1, ny, 1))
c_p1 = cell_index(g, (1, 1, 1))
c_p2 = cell_index(g, (nx, 1, 1))

fig = Figure()
ax = Axis(fig[1, 1])
Jutul.plot_mesh_edges!(ax, g)
plot_mesh!(ax, g, cells = c_i, color = :red)
plot_mesh!(ax, g, cells = [c_p1, c_p2], color = :blue)
fig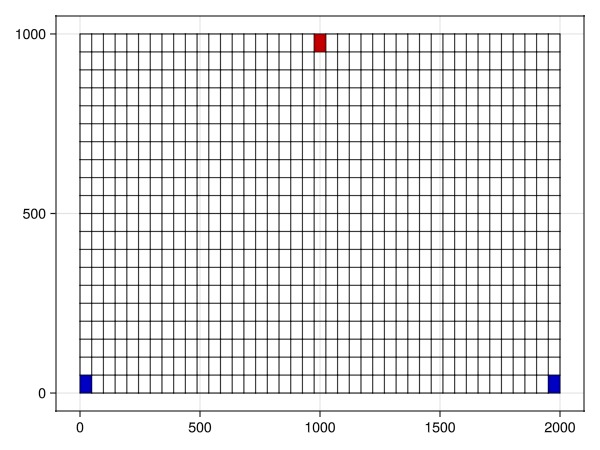
Set up reservoir and well
reservoir = reservoir_domain(g, permeability = 0.1Darcy, porosity = 0.1)
c_i1 = cell_index(g, (nx÷2+1, ny, 1))

P1 = setup_vertical_well(reservoir, nx÷2+1, ny, name = :P1)
I1 = setup_vertical_well(reservoir, 1, 1, name = :I1)
I2 = setup_vertical_well(reservoir, nx, 1, name = :I2)
DataDomain wrapping SimpleWell [I2] (1 nodes, 0 segments, 1 perforations) with 21 data fields added:
1 Perforations
:Kh => 1 Vector{Float64}
:skin => 1 Vector{Float64}
:perforation_radius => 1 Vector{Float64}
:well_index => 1 Vector{Float64}
:perforation_centroids => 3×1 Matrix{Float64}
:drainage_radius => 1 Vector{Float64}
:perforation_direction => 1 Vector{Symbol}
:cell_dims => 1 Vector{Tuple{Float64, Float64, Float64}}
:thermal_well_index => 1 Vector{Float64}
:net_to_gross => 1 Vector{Float64}
:permeability => 1 Vector{Float64}
:thermal_conductivity => 1 Vector{Float64}
1 Cells
:cell_length => 1 Vector{Float64}
:radius => 1 Vector{Float64}
:radius_inner => 1 Vector{Float64}
:cell_centroids => 3×1 Matrix{Float64}
:volume_multiplier => 1 Vector{Float64}
:casing_thickness => 1 Vector{Float64}
:grouting_thickness => 1 Vector{Float64}
:casing_thermal_conductivity => 1 Vector{Float64}
:grouting_thermal_conductivity => 1 Vector{Float64}Set up the fluid system
We set up a simple two-phase immiscible system.
phases = (AqueousPhase(), LiquidPhase())
rhoWS = rhoLS = 1000.0
rhoS = [rhoWS, rhoLS] .* kg/meter^3
sys = ImmiscibleSystem(phases, reference_densities = rhoS)
ImmiscibleSystem with AqueousPhase, LiquidPhaseDefine the tracers
We set up two tracers, one for each injector. The single-phase tracers are in this case associated with the aqueous phase and will only travel with the aqueous phase. The multiphase tracer will travel with both phases.
tracer_1 = SinglePhaseTracer(sys, AqueousPhase())
tracer_2 = MultiPhaseTracer(sys)

tracers = [tracer_1, tracer_2]
2-element Vector{JutulDarcy.Tracers.AbstractTracer}:
SinglePhaseTracer(1)
MultiPhaseTracer{2}((1, 2))Set up the schedule and reporting steps
This is similar to other examples, but we also specify the tracer concentration for the injector wells. Wells without tracer concentration specified will be assumed to have zero concentration for all tracers.
JutulDarcy supports time-varying time-steps, so it is possible to have a a tracer active for a specific time period.
dt = repeat([30.0]*day, 100)
pv = pore_volume(reservoir)
inj_rate = 0.35*sum(pv)/sum(dt)

rate_target = TotalRateTarget(inj_rate)
I_ctrl1 = InjectorControl(rate_target, [1.0, 0.0], density = rhoWS, tracers = [0.0, 1.0])
I_ctrl2 = InjectorControl(rate_target, [1.0, 0.0], density = rhoWS, tracers = [1.0, 0.0])

bhp_target = BottomHolePressureTarget(50*bar)
P_ctrl = ProducerControl(bhp_target)
controls = Dict()
controls[:I1] = I_ctrl1
controls[:I2] = I_ctrl2
controls[:P1] = P_ctrl
ProducerControl{BottomHolePressureTarget{Float64}, Float64}(BottomHolePressureTarget with value 50.0 [bar], 1.0)Set up the reservoir model and simulate
We set up the reservoir model and simulate the flow. Note that we must pass the tracers to the setup function for the reservoir model - otherwise the tracers will not be simulated.
model = setup_reservoir_model(reservoir, sys,
    wells = [I1, I2, P1],
    tracers = tracers,
)

forces = setup_reservoir_forces(model, control = controls)
state0 = setup_reservoir_state(model, Pressure = 100*bar, Saturations = [0.0, 1.0])
ws, states = simulate_reservoir(state0, model, dt, info_level = -1, forces = forces);
Plot interactively
plot_reservoir(model, states, key = :TracerMasses, step = length(dt))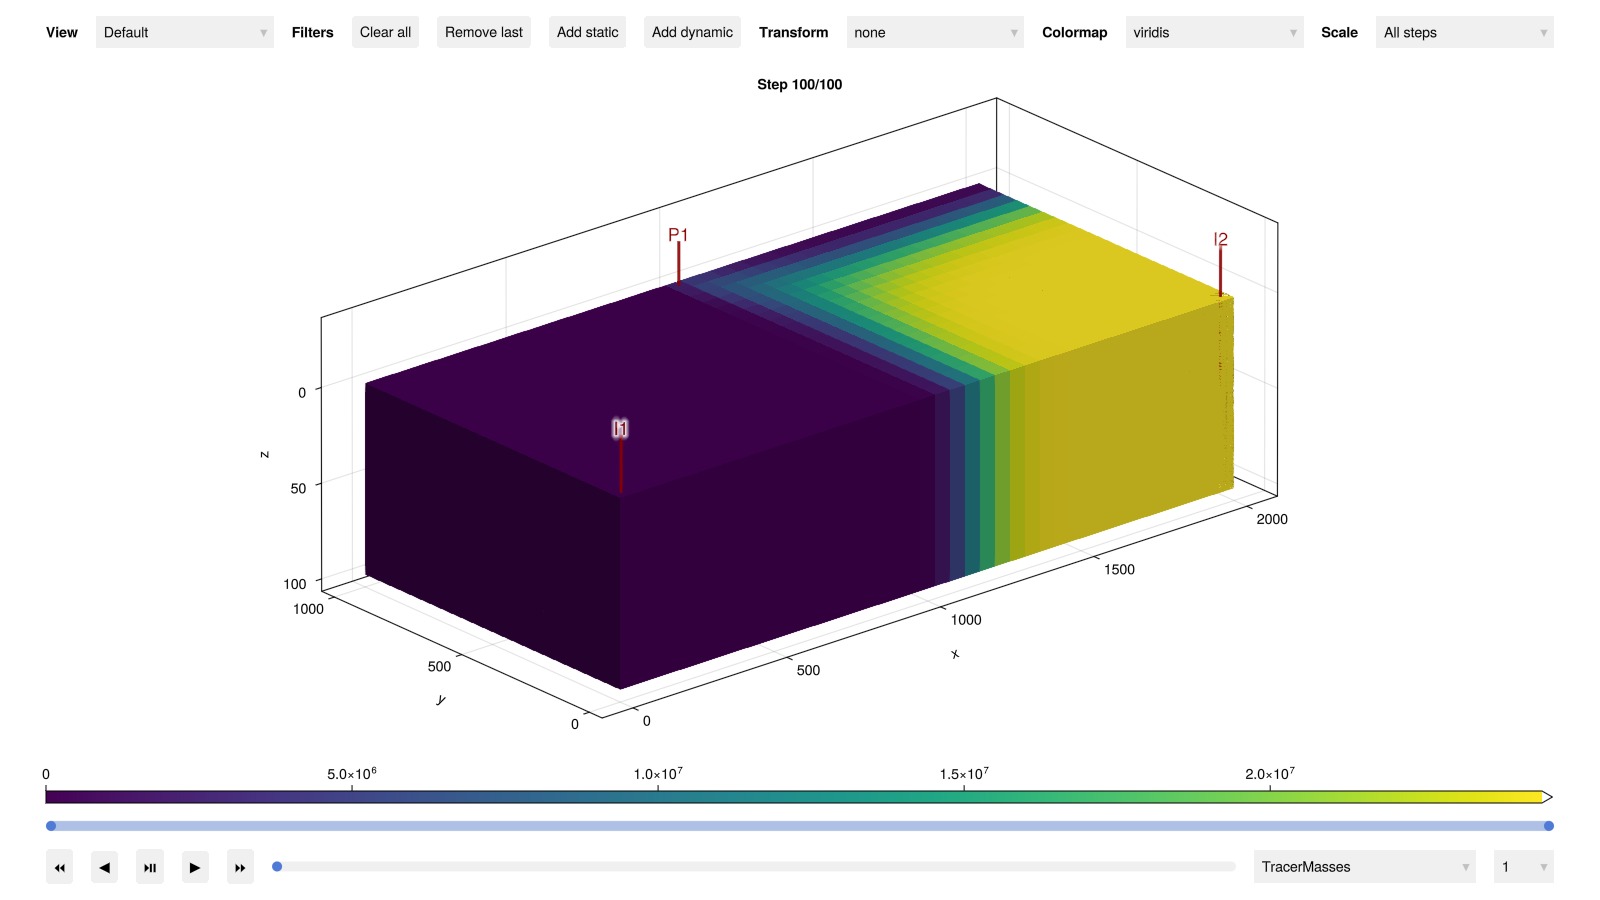
Plot the final water saturation and tracer concentrations
Note that the fluid front has filled most of the domain. The tracers give us additional information about what water volume comes from a specific injector.
tracer_mass = states[end][:TracerMasses]
sw = states[end][:Saturations][1, :]
c1 = tracer_mass[1, :]
c2 = tracer_mass[2, :]
fig = Figure(size = (600, 1200))
ax = Axis(fig[1, 1], title = "Water saturation")
plot_cell_data!(ax, g, sw)
ax = Axis(fig[2, 1], title = "Tracer from injector 1")
plot_cell_data!(ax, g, c1)
ax = Axis(fig[3, 1], title = "Tracer from injector 2")
plot_cell_data!(ax, g, c2)
fig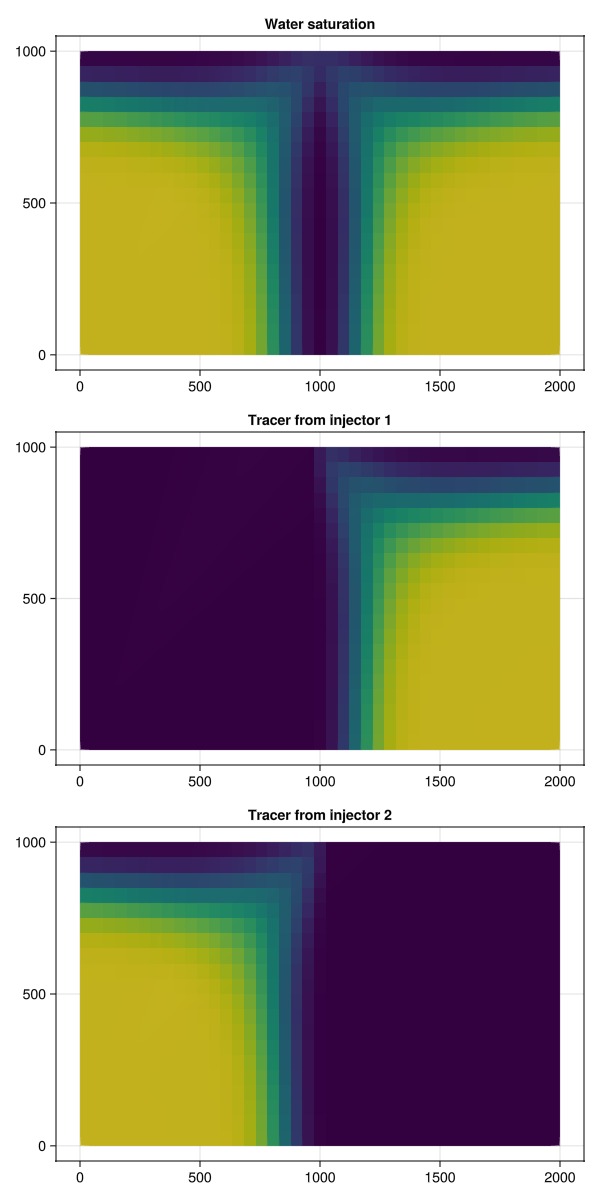
Example on GitHub
If you would like to run this example yourself, it can be downloaded from the JutulDarcy.jl GitHub repository as a script
This example took 33.252744456 seconds to complete.This page was generated using Literate.jl.