2D high-temperature geothermal benchmark
ValidationThis example demonstrates the 2D high-temperature geothermal benchmark from [5] using the pressure-enthalpy formulation in Fimbul.
We demonstrate the currently implemented magmatic-fluid-source variants: a moderate-enthalpy source that remains single-phase near the injector, and a high-enthalpy source that produces a two-phase plume during ascent. The model represents a 9 km by 3 km vertical crustal section with an open top boundary at atmospheric pressure and 10 °C, and a hot H2O source at the center of the bottom boundary. The alternative bottom heat-flux benchmark is not included here because heat-flux boundary conditions are not yet supported in Fimbul.
Small discrepancies remain because the heat flux boundary conditions are not yet implemeted in JutulDarcy/Fimbul. For now, treat this example as a qualitative validation of plume structure and phase behavior rather than an exact point-by-point match.
using Jutul, JutulDarcy, Fimbul, HYPRE, GLMakie

to_celsius(T) = convert_from_si.(T, :Celsius)
to_megapascal(p) = convert_from_si.(p, "megapascal")

nx = 91
nz = 30

const SINGLE_PHASE_TEMPERATURE_LEVELS = collect(0.0:25.0:125.0)
const TWO_PHASE_TEMPERATURE_LEVELS = collect(0.0:50.0:350.0)
const SINGLE_PHASE_PRESSURE_LEVELS = collect(0.0:5.0:50.0)
const TWO_PHASE_PRESSURE_LEVELS = collect(0.0:5.0:35.0)
const VAPOR_SATURATION_LEVELS = [0.0, 1e-6, 0.2, 0.4, 0.6, 0.8, 1.0];
Set up and simulate the benchmark cases
We simulate both fluid-source variants from Weis et al. (2014): the moderate-enthalpy single-phase plume and the hotter two-phase plume.
function simulate_benchmark_case(benchmark_case; nx = nx, nz = nz)

    case = benchmark_ht_2d(
        benchmark_case = benchmark_case,
        nx = nx,
        nz = nz,
    )
    case = Fimbul.replace_case_timesteps(case, Fimbul.load_hydrotherm_2d_timesteps(case))

    simulator, config = setup_reservoir_simulator(
        case;
        tol_cnv = 1e-5,
        tol_mb = 1e-8,
        max_timestep = Inf,
        timesteps = :none,
        relaxation = true,
    )
    sel = VariableChangeTimestepSelector(:Saturations, 0.03; model = :Reservoir, relative = false)
    push!(config[:timestep_selectors], sel)
    results = simulate_reservoir(case; simulator = simulator, config = config)
    return (case = case, results = results)
end

single_phase = simulate_benchmark_case(:single_phase_source; nx = nx, nz = nz)

two_phase = simulate_benchmark_case(:two_phase_source; nx = nx, nz = nz)

#
pad_top(values::AbstractVector, top_value) = vcat(fill(top_value, 1), values)
pad_top(values::AbstractMatrix, top_value) = hcat(fill(top_value, size(values, 1), 1), values)

function section_cell_axes(case)
    domain = case.model.models[:Reservoir].data_domain
    geometry = tpfv_geometry(physical_representation(domain))
    centroids = geometry.cell_centroids
    x0 = case.input_data[:x_coordinate_origin]
    x = sort(unique(vec(centroids[1, :] .- x0))) ./ 1e3
    depth = sort(unique(vec(centroids[3, :]))) ./ 1e3
    return (x_km = x, depth_km = depth)
end

function section_axes(case)
    axes = section_cell_axes(case)
    return (x_km = axes.x_km, depth_km = pad_top(axes.depth_km, 0.0))
end

function section_data(case, values; top_value)
    axes = section_cell_axes(case)
    nx = length(axes.x_km)
    nz = length(axes.depth_km)
    return pad_top(reshape(vec(values), nx, nz), top_value)
end

function load_hydrotherm_reference(case)
    return Fimbul.load_hydrotherm_2d_reference(case)
end

to_vapor_saturation(S) = vec(S[2, :])

final_time_years(case) = round(Int, convert_from_si(sum(case.dt), :year))

function source_location_km(case)
    domain = case.model.models[:Reservoir].data_domain
    centroids = tpfv_geometry(physical_representation(domain)).cell_centroids
    source_cell = case.input_data[:source_cell]
    x0 = case.input_data[:x_coordinate_origin]
    return (
        x_km = (centroids[1, source_cell] - x0) / 1e3,
        depth_km = centroids[3, source_cell] / 1e3,
    )
end


function contour_colorbar_ticks(levels)
    ticks = collect(levels)
    labels = map(ticks) do value
        rounded = round(value; digits = 1)
        if isapprox(rounded, round(rounded))
            string(Int(round(rounded)))
        else
            string(rounded)
        end
    end
    return (ticks, labels)
end

function final_state_field_specs(case, results)
    axes = section_axes(case)
    source = source_location_km(case)
    state = results.states[end]
    final_years = final_time_years(case)
    source_regime = case.input_data[:source_regime]
    hydrotherm = load_hydrotherm_reference(case)

    temperature = to_celsius(section_data(case, state[:Temperature]; top_value = case.input_data[:top_temperature]))
    pressure = to_megapascal(section_data(case, state[:Pressure]; top_value = case.input_data[:top_pressure]))

    temperature_levels = source_regime == :two_phase ? TWO_PHASE_TEMPERATURE_LEVELS : SINGLE_PHASE_TEMPERATURE_LEVELS
    pressure_levels = source_regime == :two_phase ? TWO_PHASE_PRESSURE_LEVELS : SINGLE_PHASE_PRESSURE_LEVELS

    specs = Any[
        (
            title = "Temperature after $(final_years) years",
            values = temperature,
            hydrotherm_values = hydrotherm.temperature,
            levels = temperature_levels,
            colormap = :seaborn_icefire_gradient,
            colorbar_label = "Temperature [°C]",
        ),
        (
            title = "Pressure after $(final_years) years",
            values = pressure,
            hydrotherm_values = hydrotherm.pressure,
            levels = pressure_levels,
            colormap = :vik,
            colorbar_label = "Pressure [MPa]",
        ),
    ]

    if source_regime == :two_phase
        vapor_saturation = clamp.(section_data(case, to_vapor_saturation(state[:Saturations]); top_value = 0.0), 0.0, 1.0)
        push!(specs,
            (
                title = "Vapor saturation after $(final_years) years",
                values = vapor_saturation,
                hydrotherm_values = hydrotherm.vapor_saturation,
                levels = VAPOR_SATURATION_LEVELS,
                colormap = :dense,
                colorbar_label = "Vapor saturation [-]",
            ),
        )
    end

    return (axes = axes, source = source, specs = specs, hydrotherm = hydrotherm)
end

function plot_final_state(case, results)
    state = final_state_field_specs(case, results)
    axes = state.axes
    source = state.source
    specs = state.specs
    hydrotherm = state.hydrotherm

    fig = Figure(size = (520*length(specs), 520))
    for (i, spec) in enumerate(specs)
        ax = Axis(
            fig[1, i];
            limits = ((-2.0, 2.0), (0.0, 3.0)),
            title = spec.title,
            xlabel = "Distance [km]",
            ylabel = ifelse(i == 1, "Depth [km]", ""),
            yreversed = true,
            aspect = AxisAspect(4/3),
        )
        plt = contourf!(ax, axes.x_km, axes.depth_km, spec.values;
            colormap = spec.colormap,
            levels = spec.levels,
        )
        contour!(ax, hydrotherm.x_km, hydrotherm.depth_km, spec.hydrotherm_values;
            levels = spec.levels,
            color = :white,
            linewidth = 5,
            linestyle = :dash,
        )
        contour!(ax, axes.x_km, axes.depth_km, spec.values;
            color = :white,
            levels = spec.levels,
        )
        if i == 2
            le = [
                LineElement(color = :white),
                LineElement(color = :white, linestyle = :dash, linewidth = 5)
            ]
            axislegend(
                ax, le, ["Fimbul", "HYDROTHERM"];
                position = :rt, framevisible = false, labelcolor = :white,
                labelsize = 12, patchsize = (25, 10),
            )
        end
        scatter!(ax, [source.x_km], [source.depth_km]; color = :black, marker = :star5, markersize = 14)
        if i > 1
            hideydecorations!(ax, ticks = false)
        end
        Colorbar(fig[2, i], plt;
            vertical = false,
            label = spec.colorbar_label,
            ticks = contour_colorbar_ticks(spec.levels),
            flipaxis = false,
        )
    end
    is_ax = [f isa Axis for f in fig.content]
    linkaxes!(fig.content[is_ax]...)
    return fig
end;
Jutul: Simulating 4999 years, 41 weeks as 1090 report steps
╭────────────────┬────────────┬────────────────┬───────────╮
│ Iteration type │ Avg/step │ Avg/ministep │ Total │
│ │ 1090 steps │ 1090 ministeps │ (wasted) │
├────────────────┼────────────┼────────────────┼───────────┤
│ Newton │ 1.98349 │ 1.98349 │ 2162 (0) │
│ Linearization │ 2.98349 │ 2.98349 │ 3252 (0) │
│ Linear solver │ 8.26789 │ 8.26789 │ 9012 (0) │
│ Precond apply │ 16.5358 │ 16.5358 │ 18024 (0) │
╰────────────────┴────────────┴────────────────┴───────────╯
╭───────────────┬─────────┬────────────┬─────────╮
│ Timing type │ Each │ Relative │ Total │
│ │ ms │ Percentage │ s │
├───────────────┼─────────┼────────────┼─────────┤
│ Properties │ 1.0617 │ 7.72 % │ 2.2955 │
│ Equations │ 2.5939 │ 28.37 % │ 8.4353 │
│ Assembly │ 0.8588 │ 9.39 % │ 2.7928 │
│ Linear solve │ 0.4267 │ 3.10 % │ 0.9225 │
│ Linear setup │ 2.2397 │ 16.29 % │ 4.8422 │
│ Precond apply │ 0.2253 │ 13.66 % │ 4.0609 │
│ Update │ 0.6620 │ 4.81 % │ 1.4313 │
│ Convergence │ 0.6578 │ 7.20 % │ 2.1392 │
│ Input/Output │ 0.5243 │ 1.92 % │ 0.5715 │
│ Other │ 1.0353 │ 7.53 % │ 2.2384 │
├───────────────┼─────────┼────────────┼─────────┤
│ Total │ 13.7509 │ 100.00 % │ 29.7295 │
╰───────────────┴─────────┴────────────┴─────────╯
Jutul: Simulating 4999 years, 39.8 weeks as 3205 report steps
╭────────────────┬────────────┬────────────────┬───────────╮
│ Iteration type │ Avg/step │ Avg/ministep │ Total │
│ │ 3205 steps │ 3260 ministeps │ (wasted) │
├────────────────┼────────────┼────────────────┼───────────┤
│ Newton │ 2.12012 │ 2.08436 │ 6795 (0) │
│ Linearization │ 3.13729 │ 3.08436 │ 10055 (0) │
│ Linear solver │ 9.45616 │ 9.29663 │ 30307 (0) │
│ Precond apply │ 18.9123 │ 18.5933 │ 60614 (0) │
╰────────────────┴────────────┴────────────────┴───────────╯
╭───────────────┬────────┬────────────┬─────────╮
│ Timing type │ Each │ Relative │ Total │
│ │ ms │ Percentage │ s │
├───────────────┼────────┼────────────┼─────────┤
│ Properties │ 1.0758 │ 13.22 % │ 7.3104 │
│ Equations │ 0.9047 │ 16.45 % │ 9.0964 │
│ Assembly │ 0.2023 │ 3.68 % │ 2.0344 │
│ Linear solve │ 0.3933 │ 4.83 % │ 2.6722 │
│ Linear setup │ 2.3588 │ 28.98 % │ 16.0283 │
│ Precond apply │ 0.2245 │ 24.61 % │ 13.6086 │
│ Update │ 0.0947 │ 1.16 % │ 0.6434 │
│ Convergence │ 0.2640 │ 4.80 % │ 2.6545 │
│ Input/Output │ 0.1068 │ 0.63 % │ 0.3480 │
│ Other │ 0.1329 │ 1.63 % │ 0.9032 │
├───────────────┼────────┼────────────┼─────────┤
│ Total │ 8.1382 │ 100.00 % │ 55.2994 │
╰───────────────┴────────┴────────────┴─────────╯Single-phase source case
The moderate-enthalpy source generates an upward-rising thermal plume that stays in the liquid regime. At late time, the deepest part of the plume also carries the highest absolute pressures near the source.
plot_reservoir(single_phase.case, single_phase.results.states;
    key = :Temperature, step = length(single_phase.case.dt),
    colormap = :seaborn_icefire_gradient, aspect = (9,0.1,3), axis_view = :xz)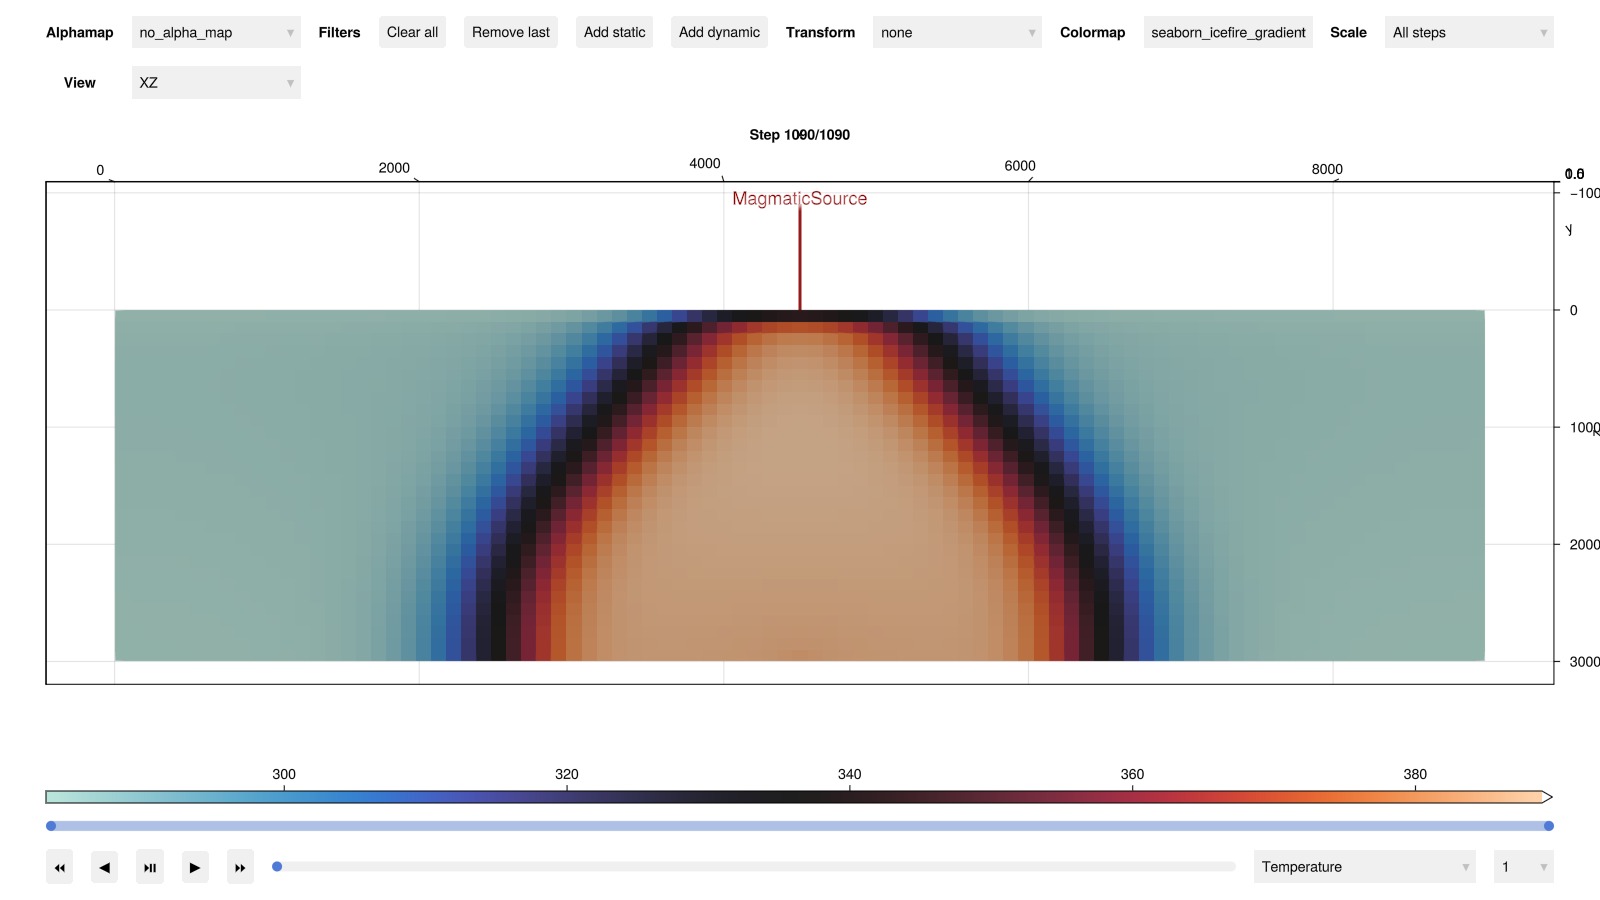
Validate against reference data
fig_single_phase_final = plot_final_state(single_phase.case, single_phase.results)
fig_single_phase_final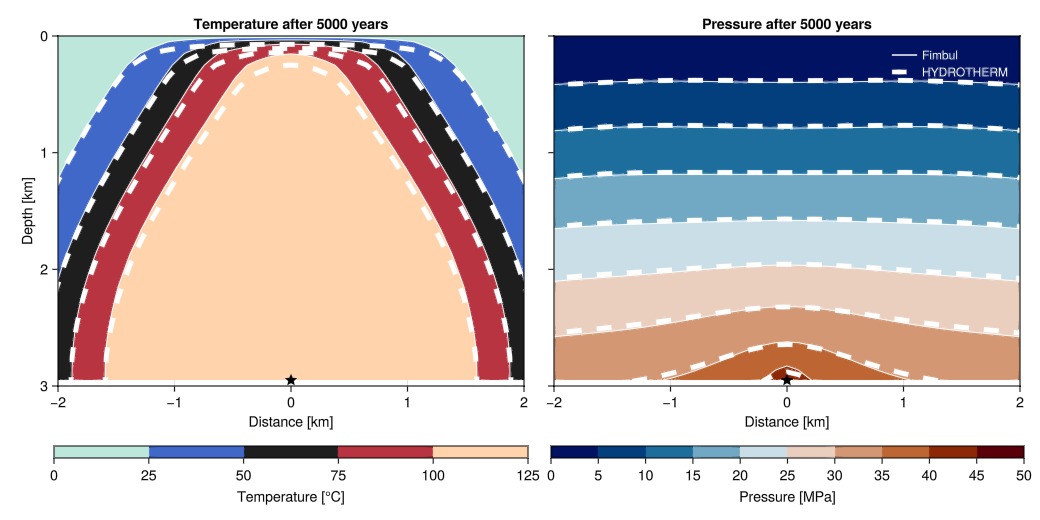
Two-phase source case
Raising the source enthalpy to 1.5 MJ/kg produces a hotter plume that enters the two-phase field during ascent. At late time, the plume maintains high deep pressures near the source and develops a liquid-saturation deficit where vapor forms in the rising core.
plot_reservoir(two_phase.case, two_phase.results.states;
    key = :Temperature, step = length(two_phase.case.dt),
    colormap = :seaborn_icefire_gradient, aspect = (9,0.1,3), axis_view = :xz)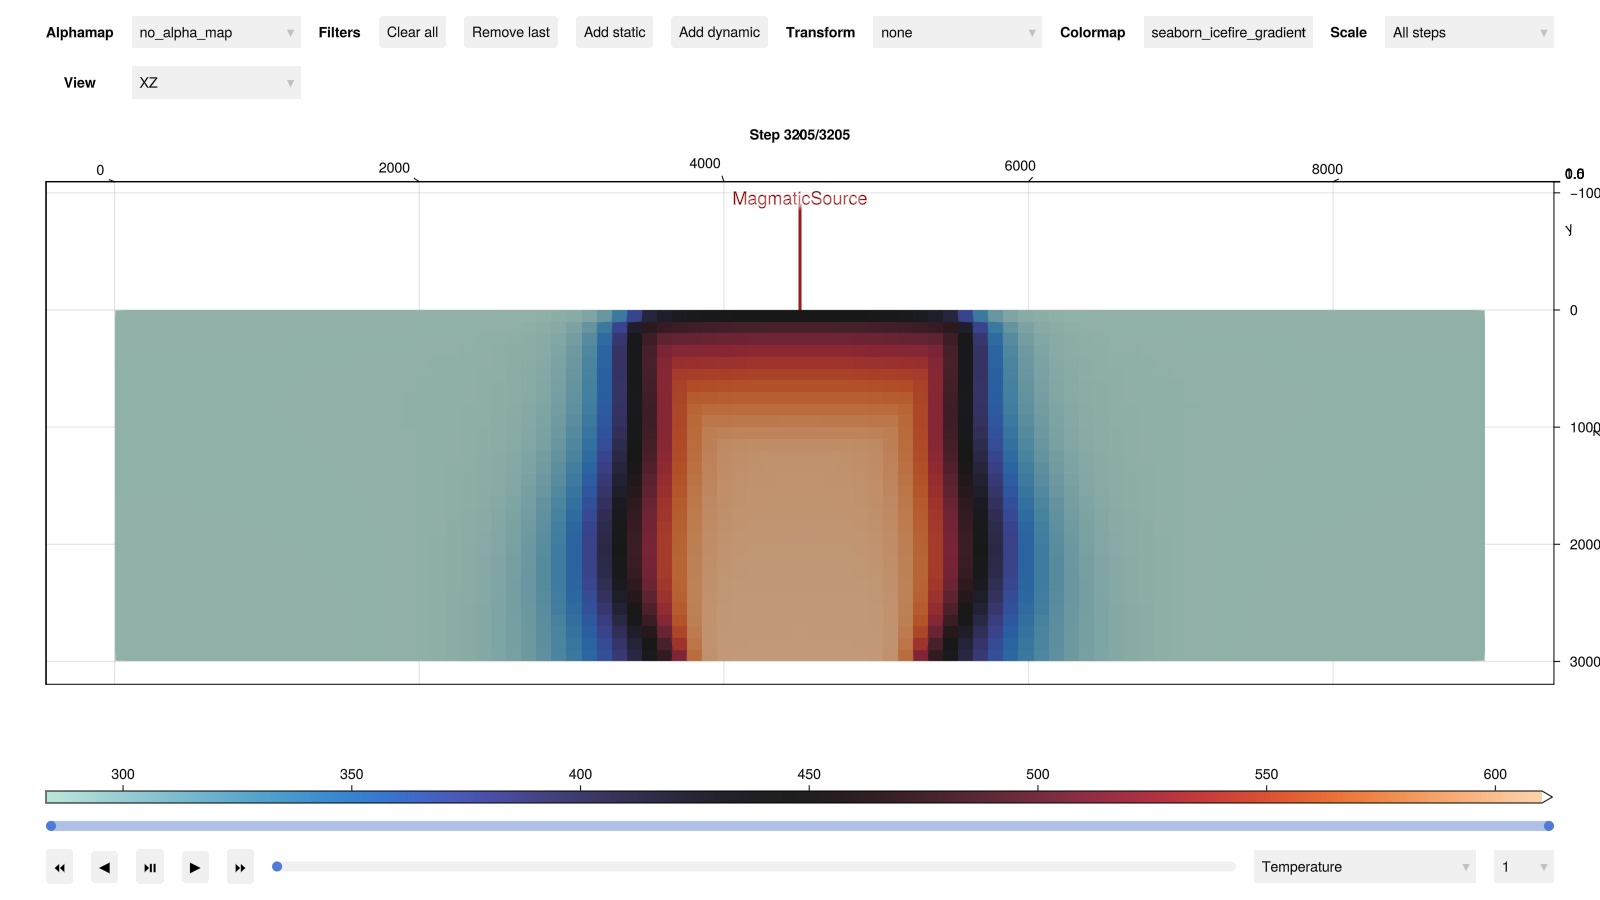
Validate against reference data
fig_two_phase = plot_final_state(two_phase.case, two_phase.results)
fig_two_phase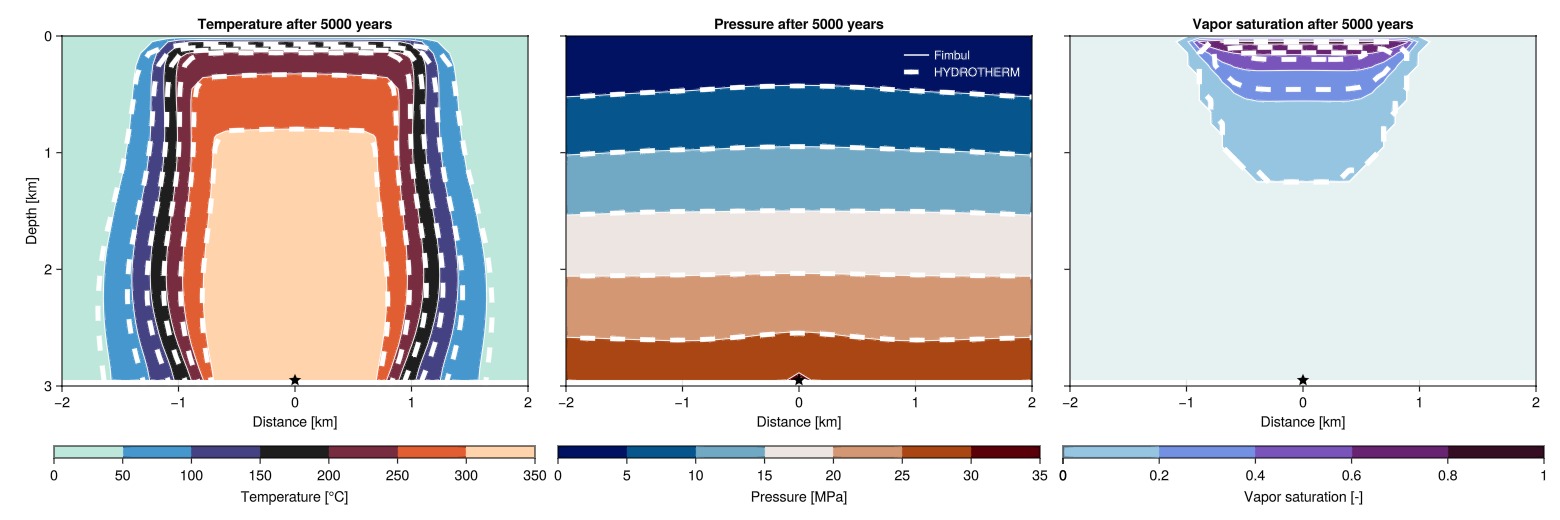
Example on GitHub
If you would like to run this example yourself, it can be downloaded from the Fimbul.jl GitHub repository as a script.
This example took 132.422290904 seconds to complete.This page was generated using Literate.jl.