Thermodynamics and PVT tabulation
H2sim connects hydrogen–brine phase behavior to compositional flow and black-oil storage simulations. Choose a property model, examine its partitioning and salinity response, then generate the tables your flow model requires.
Phase-behavior capabilities
Approach |
Capability |
Implementation |
|---|---|---|
Redlich–Kwong (RK) |
Hydrogen dissolution and water partitioning, including salt corrections |
|
Søreide–Whitson (SW) |
Compositional gas–liquid flash with salinity-dependent interactions |
|
Peng–Robinson (PR) |
General compositional flash; binary interactions can be specified |
MRST |
Henry–Setschenow |
Dissolved hydrogen from H₂ partial pressure, temperature, and salt molality |
|
ePC-SAFT reference tables |
Compare gas and liquid partitioning with supplied tabulated reference values |
Bundled |
Black-oil PVT tables |
Formation-volume factors, solution ratio, vaporized-water ratio, and viscosities |
|
Two selected studies
Run the existing hydrogen–brine study:
study = exampleH2BrineSolubilityStudy;
plotH2BrineSolubilityStudy(study);
The first study evaluates partitioning over the reference temperature and pressure grid. The figure shows the 50 °C slice from 6 to 20 MPa. It compares hydrogen in liquid water and water in the hydrogen gas phase. The supplied ePC-SAFT values are a near-pure-water reference. The generic PR curve uses its default binary interactions; it is not a calibrated hydrogen–water model. Henry–Setschenow supplies liquid hydrogen solubility, not gas-phase water.
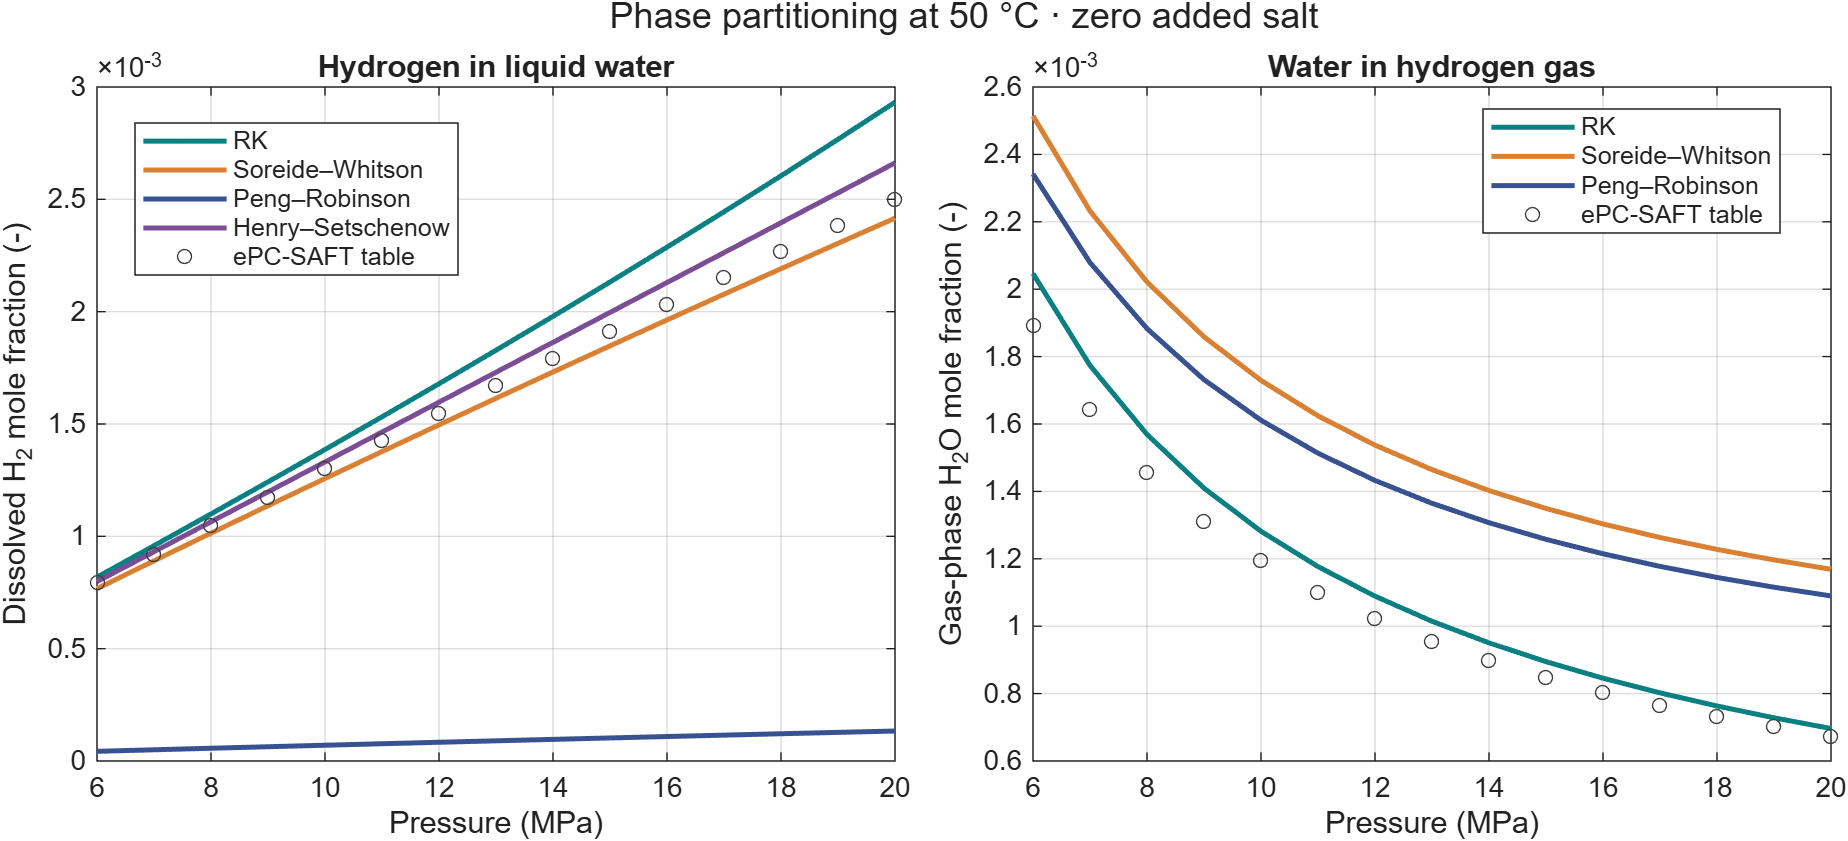
Phase partitioning at zero added salt. Curves represent distinct property models; agreement with a reference curve does not validate every model over other temperatures, pressures, or salt concentrations.
The same saved grid also shows the temperature response from 1 to 99 °C at 15 MPa, with zero added salt. Both panels use the same model definitions as the pressure comparison; the ePC-SAFT markers are tabulated reference values.
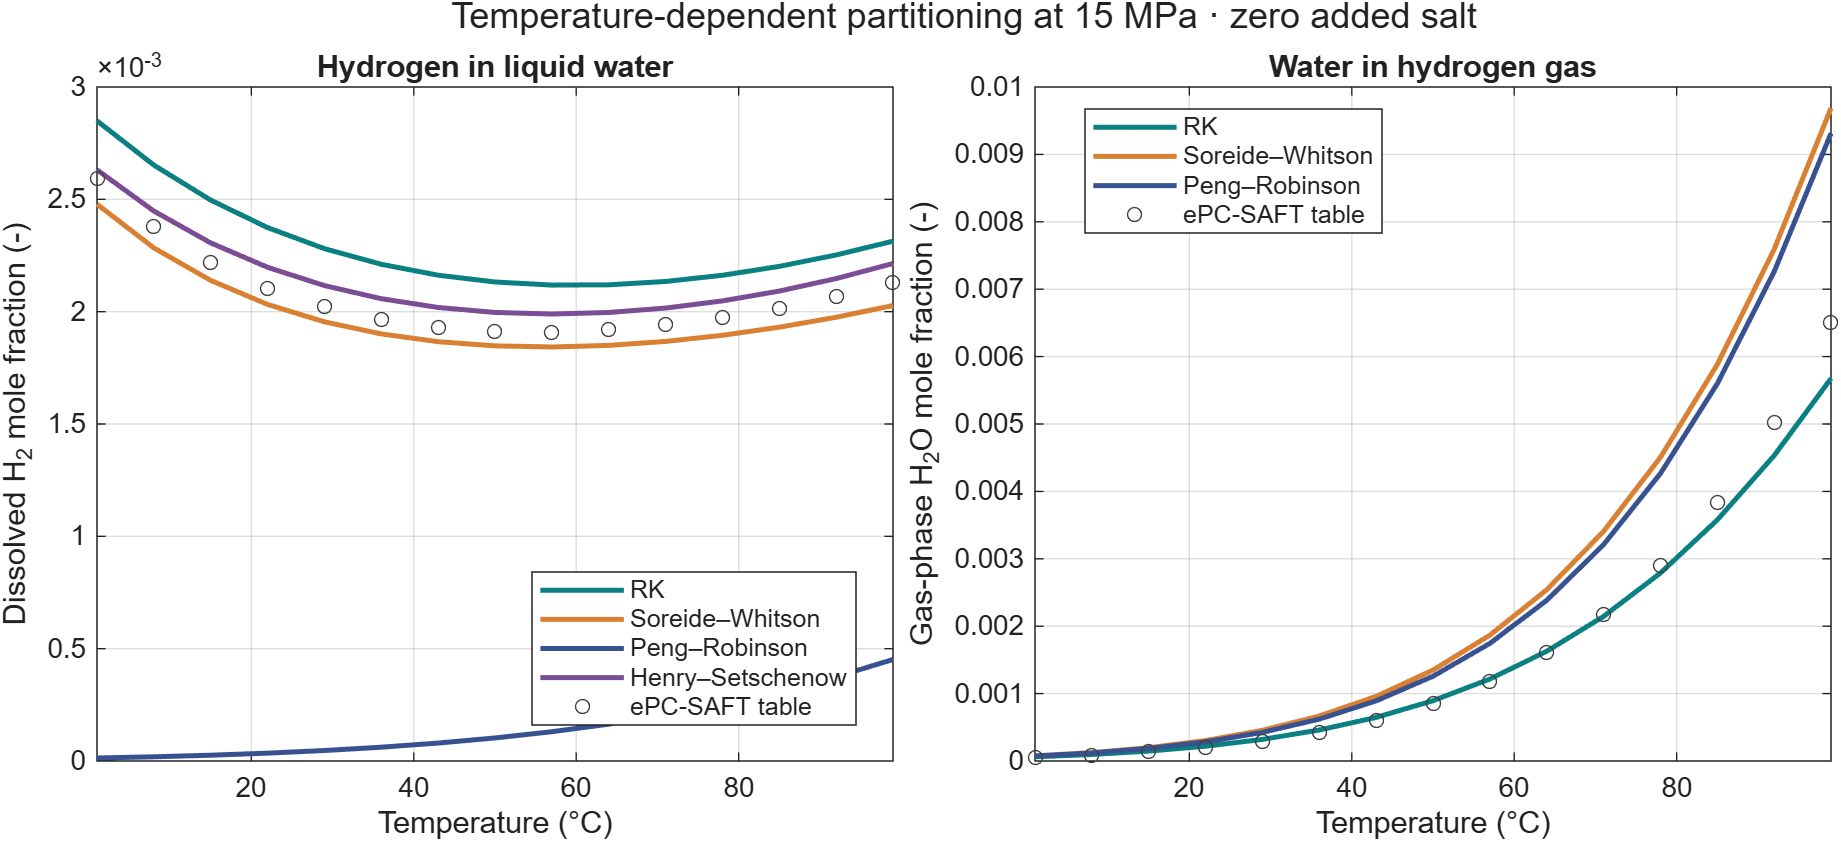
Temperature-dependent hydrogen–water partitioning. Henry–Setschenow provides only the dissolved-hydrogen curve.
The second study holds temperature at 40 °C and pressure at 15 MPa while varying NaCl molality from zero to 5 mol/kg water. Absolute solubility and solubility normalized by the zero-salt value show the salting-out response without mixing it with a pressure or temperature change.
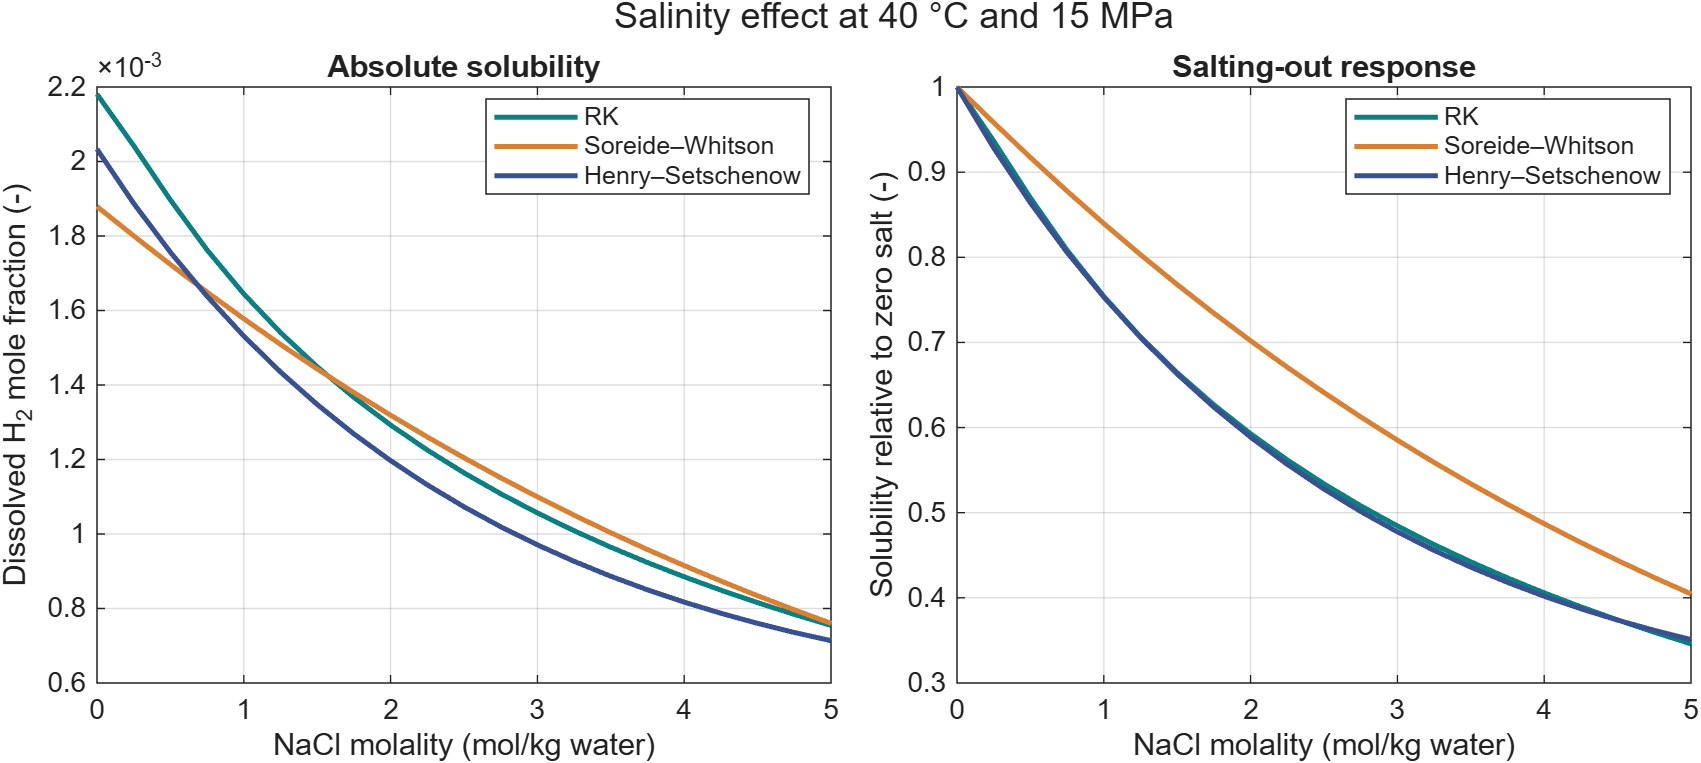
Salting-out comparison. These are implemented model calculations, not newly measured experimental data.
From phase behavior to black-oil PVT
examplePVTGenerationH2Brine demonstrates the complete tabulation route:
Generate pure hydrogen and water density/viscosity tables with
generateComponentProperties.Compute dissolved hydrogen and water partitioning with
generateH2BrineSolubilityTableor supply compatible reference tables.Pass matching temperature/pressure samples to
getFluidH2BrineProps.Export
PVTO,PVDO, andPVTGtables as selected by the dissolution and vaporization options, then use them in an Eclipse deck.
getFluidH2BrineProps(waterTable, hydrogenTable, solubilityTable, ...
    'rs', true, 'rv', false, 'plot', true, ...
    'outputPath', fullfile(pwd, 'build', 'pvt-tables'));
The pure-component generation scripts fetch NIST data when creating new tables. The two selected studies run locally from correlations and bundled reference data, and require no Parallel Computing Toolbox. The 2D aquifer example reads existing PVT tables rather than regenerating them.
Units and interpretation
Compositional flashes use temperature in kelvin and pressure in pascals. The solubility-table generator’s temperature bounds are in degrees Celsius; its pressure bounds are in pascals. NaCl molality is mol/kg water. Brill–Beggs returns a dimensionless hydrogen compressibility factor from kelvin and pascals. PVT exports use the selected deck unit system.
For Henry–Setschenow, the pressure input is the hydrogen partial pressure. The selected hydrogen-dominated comparison approximates it by total pressure. PHREEQC handles aqueous speciation and mineral chemistry; the EOS retains ownership of the gas–liquid split in the coupled workflows.