Hydrogen storage in saline aquifers
Black-oil models · h2-store
The storage module connects hydrogen–brine fluid properties to MRST black-oil models. It provides PVT tabulation, relative-permeability tools, and aquifer setups for injection, storage, and withdrawal.
A 2D structural-trap example
result = exampleBlackOilAquifer2D('numCycles', 5);
This example uses the existing 50 m × 50 m illustrative aquifer setup. A curved low-permeability caprock overlies the reservoir, with bedrock below. A single well sits beneath the crest. Gravity, capillary pressure, and hydrogen dissolution are included; lateral boundaries use hydrostatic pressure. The bundled input uses zero added salt and disables diffusion.
The default teaching grid has a 2 m target spacing. The original setup’s 0.5 m target spacing remains available. The schedule includes a 120-day hydrogen build-up, a 30-day shut-in, then five 70-day storage cycles (30 days of injection, 10 days idle, and 30 days withdrawal). Results are saved through MRST packed simulation output and can be replotted locally. Withdrawal has a 35 bar minimum bottom-hole pressure limit, so the well can reduce its rate as available hydrogen decreases.
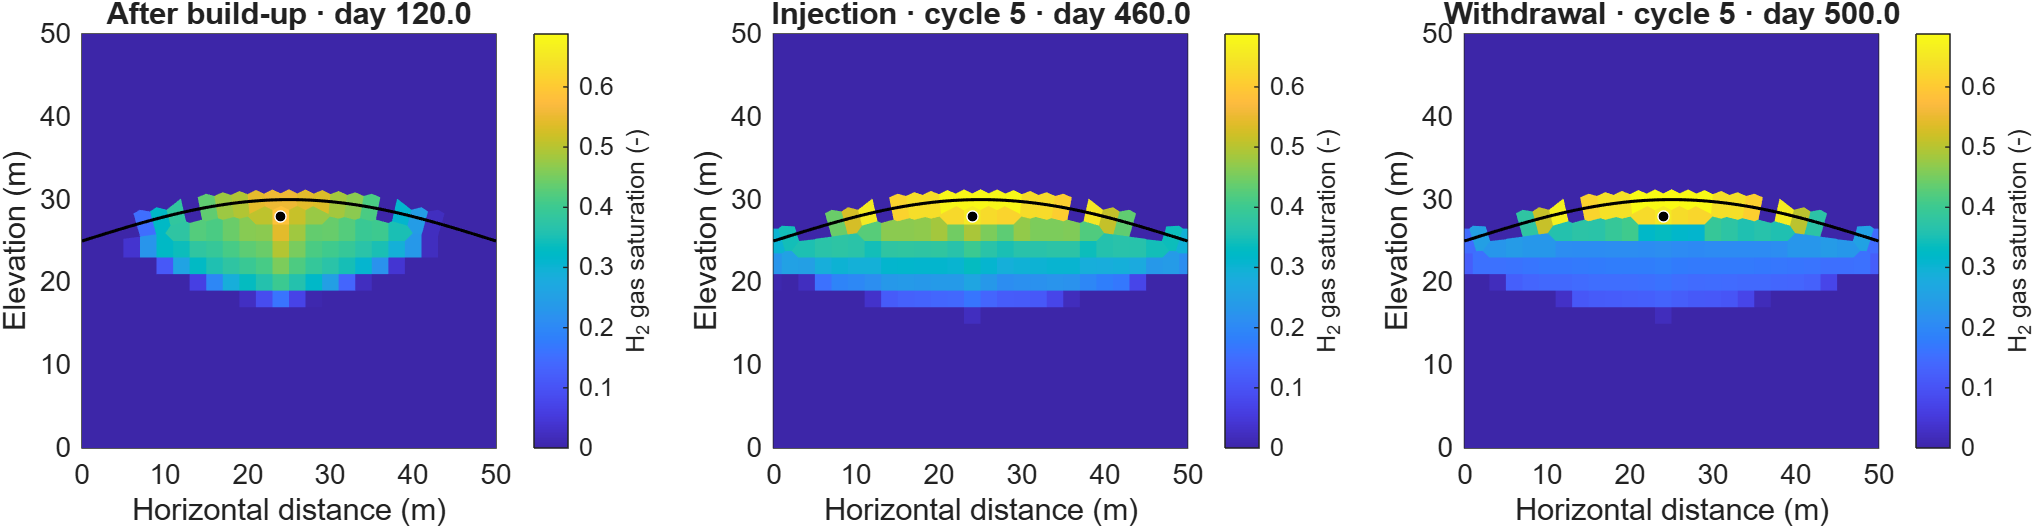
Hydrogen plume snapshots after build-up and in the fifth cycle. The same saturation color scale is used in every panel.
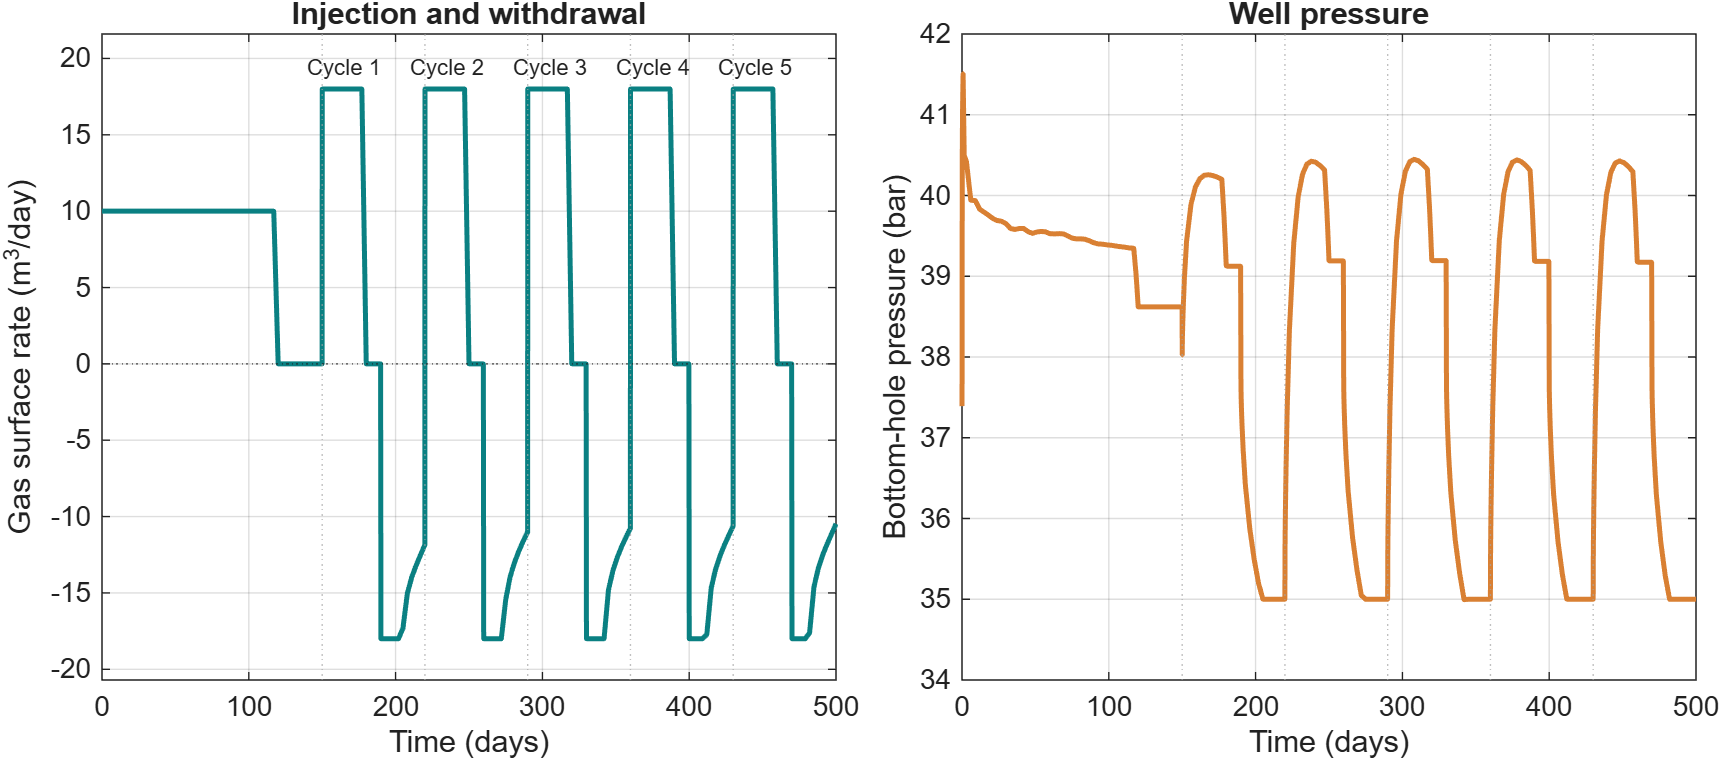
Well response through the prescribed storage schedule. Positive gas rate denotes injection and negative gas rate denotes withdrawal.
Hydrogen loss due to dissolution
Dissolution transfers hydrogen from the free-gas plume into brine. We report its surface-equivalent volume and its fraction of the hydrogen inventory remaining inside the modeled reservoir:
Here, \(c\) indexes cells, \(PV\) is pore volume, \(S\) is phase saturation, \(b=1/B\) is the inverse formation-volume factor, and \(R_s\) is the dissolved gas solution ratio. Both volumes use the same surface conditions. This metric describes loss from the free-gas inventory; it is not cumulative loss relative to injected hydrogen or irreversible consumption. Hydrogen can exsolve during pressure decline, and the fraction can increase during withdrawal as the free-gas inventory decreases.
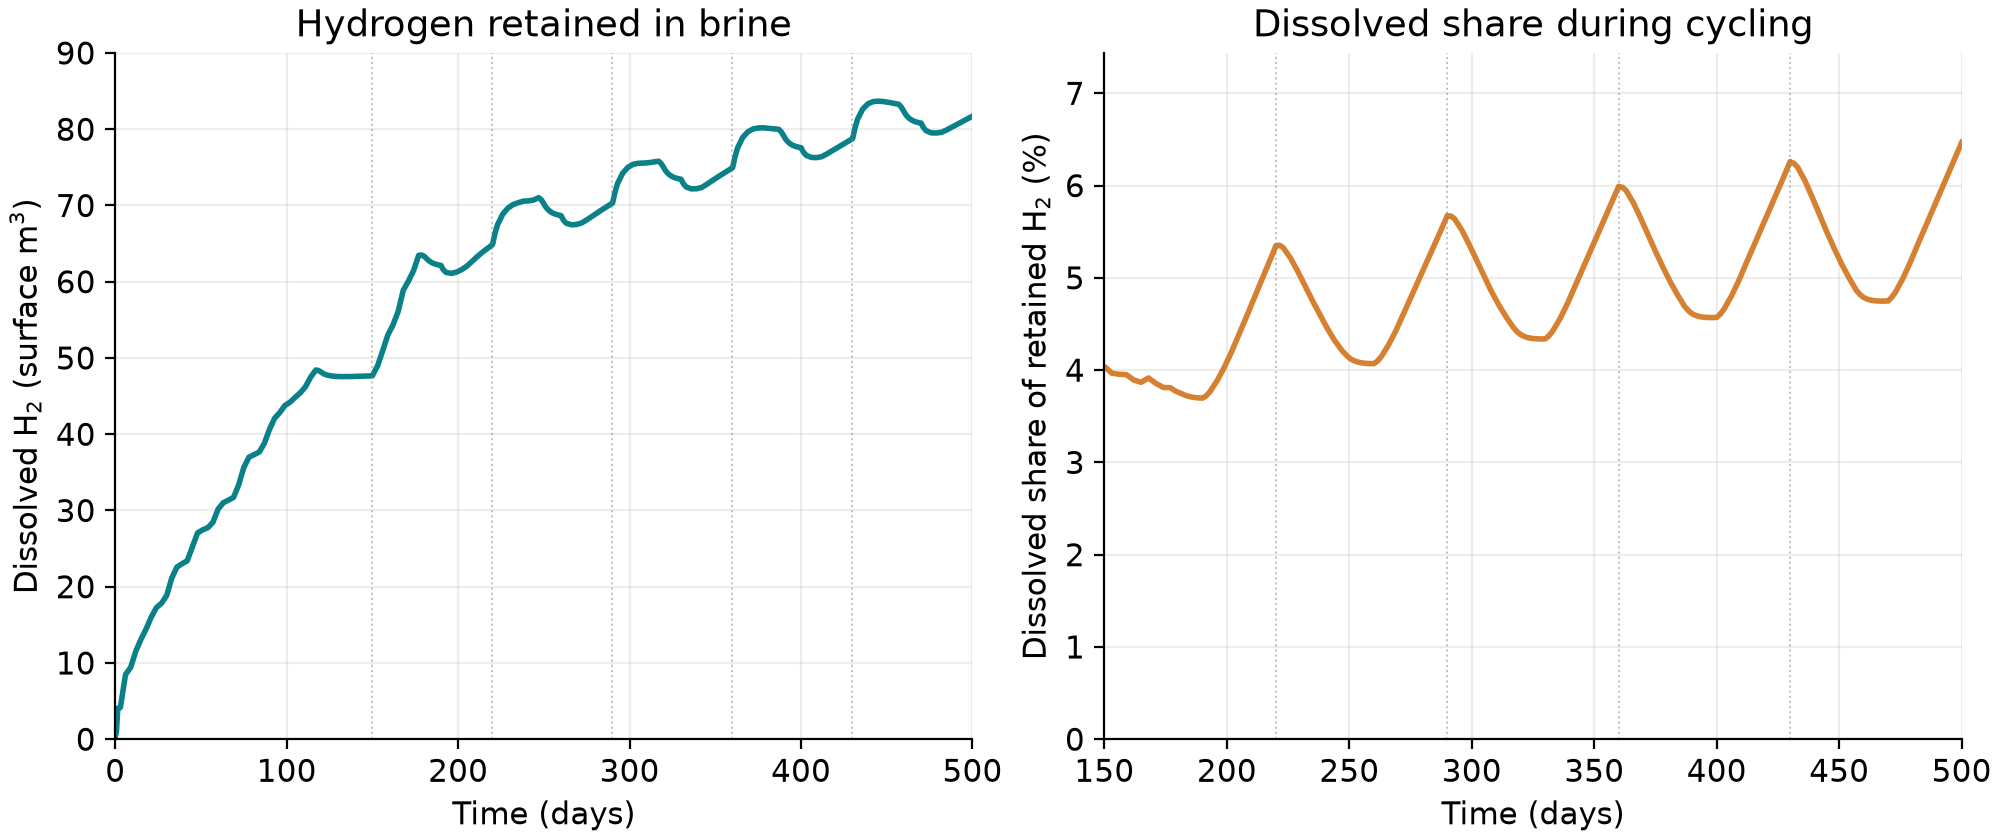
Hydrogen partitioned into brine throughout build-up and cycling (left), with the dissolved share shown over the cycling period (right).
Black-oil interpretation
The MRST oil phase represents liquid water/brine and the gas phase represents
hydrogen. DISGAS enables hydrogen dissolved in the liquid; VAPOIL
enables vaporized water when supported by the supplied PVT tables. The
selected aquifer deck enables dissolution and does not enable vaporization.
The example uses the public illustrative-case input tables accompanying
Ahmed et al., Phase behavior and black-oil simulations of hydrogen storage
in saline aquifers (2024). Input provenance is recorded in
h2-store/examples/data/Aquifer2D/README.md.
Build fluid tables
examplePVTGenerationH2Brine demonstrates pure-component properties,
solubility, and PVT generation. New NIST data tables require network access.
See Thermodynamics and PVT tabulation for RK, SW, Henry–Setschenow, ePC-SAFT reference
comparisons, and the route from phase behavior to black-oil tables.
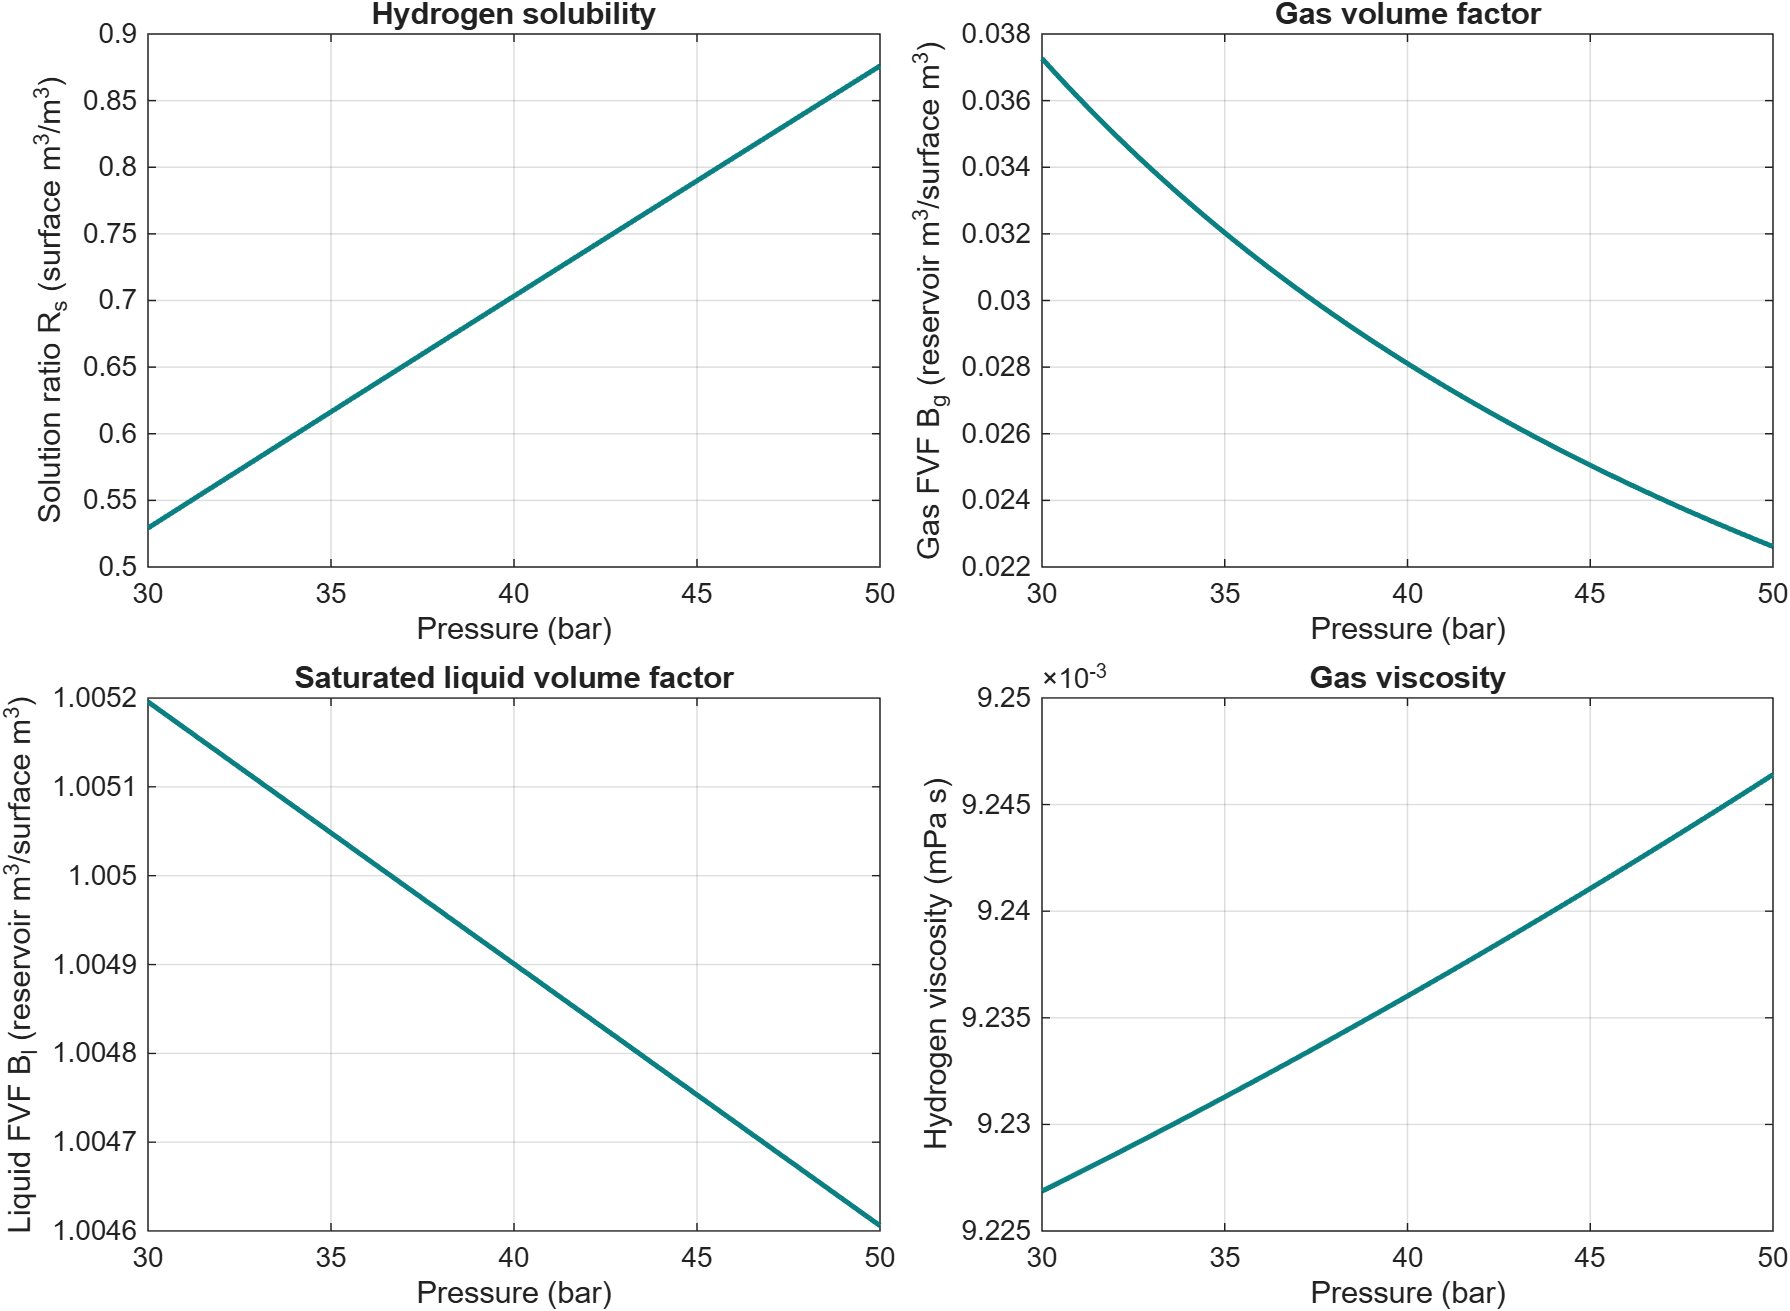
PVT functions from the bundled aquifer input, evaluated over 30–50 bar. These are the existing simulation tables, not newly generated NIST data.
Replot the fluid properties from a saved aquifer result:
plotAquiferFluidTables(result);