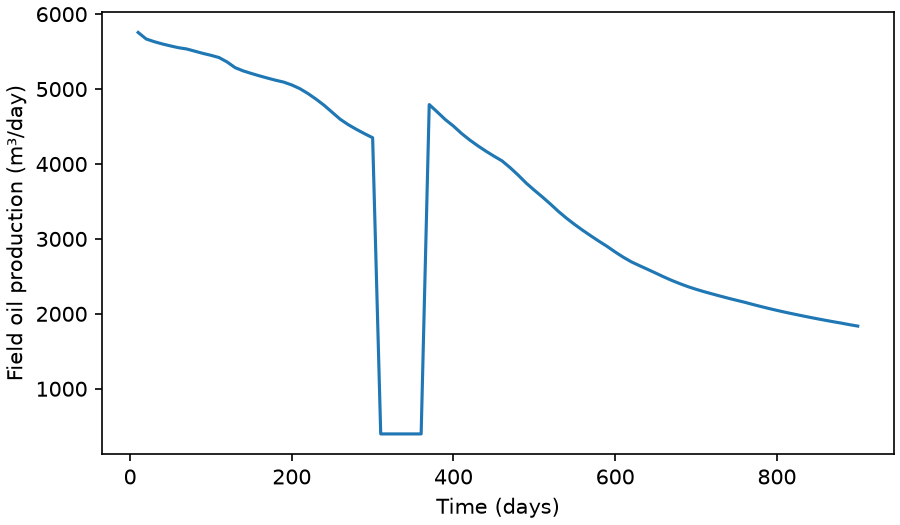
Run the SPE9 black-oil benchmark and plot field oil production.
The dataset is downloaded on first use and cached by JutulDarcy. Install
matplotlib with python -m pip install matplotlib to run this example.
This example is executed during every documentation build.
"""Run the SPE9 black-oil benchmark and plot field oil production.

The dataset is downloaded on first use and cached by JutulDarcy. Install
matplotlib with `python -m pip install matplotlib` to run this example.
"""

from pathlib import Path

import matplotlib.pyplot as plt
import numpy as np

import jutuldarcy as jd


def main(output_dir=None):
    path = jd.test_file_path("SPE9", "SPE9.DATA")
    output = jd.simulate_data_file(path, convert=True, units="metric", info_level=-1)
    days, rate = output["DAYS"], output["FIELD"]["FOPR"]
    np.testing.assert_allclose(days, np.arange(1, 91) * 10.0)
    assert len(days) == len(rate)
    assert np.isfinite(rate).all()
    print(f"Completed SPE9: {len(days)} reporting steps, {days[-1]:g} days.")
    figure, axes = plt.subplots(figsize=(6, 3.5), layout="constrained")
    axes.plot(days, rate)
    axes.set(xlabel="Time (days)", ylabel="Field oil production (m³/day)")
    if output_dir is None:
        plt.show()
    else:
        figure.savefig(Path(output_dir) / "oil-production.png", dpi=150)
    plt.close(figure)
    return output


if __name__ == "__main__":
    main()
Output
Completed SPE9: 90 reporting steps, 900 days.